Once you’ve set breakpoints, you can run your application until a breakpoint is encountered. Then you can use the debugger to view the state of your application and control further execution.
When a breakpoint is encountered while the application is running, the Script Debugger window will open. The script containing the breakpoint will be displayed, and a yellow arrow will indicate where execution stopped. An example of this is shown in the following illustration.
![]()

Execution of the application is suspended, allowing you to examine the current state of the application. The tools available for this purpose are explained in the next section.
While the application is stopped at a breakpoint, all application operations are suspended. You must use the Go or Step menu commands in the Debug menu (or their corresponding buttons in the Script Debugger window) to continue executing the application.
Choosing Go from the Debug menu or clicking the Go button in the Script Debugger window causes the application to continue execution until another breakpoint is encountered or all scripts finish.

|
You can’t exit test mode while stopped at a breakpoint. To exit test mode, the scripts currently running must finish executing. Mark the Ignore All Breakpoints option in the Breakpoints window and then click Go to allow all scripts to finish executing without stopping at any breakpoints. Then you can exit test mode. |
Choosing Step from the Debug menu or clicking the Step button in the Script Debugger window causes the next line of the current script to be executed. The application is then suspended as if another breakpoint had been encountered. This is useful when you want to step through an application line-by-line to see how individual statements affect the application.
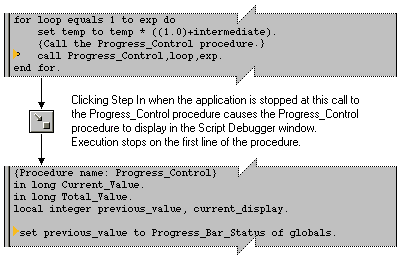
Step In is used when the application is stopped on a line that calls a procedure or user-defined function, or uses the run script statement. Choosing Step In from the Debug menu or clicking the Step In button causes the called script to appear in the Script Debugger window. Execution stops on the first line of that script.
For example, if execution has stopped on the following line containing a procedure call, clicking the Step In button in the Script Debugger window causes the procedure script to open and stop execution on the first line of the procedure.
![]()

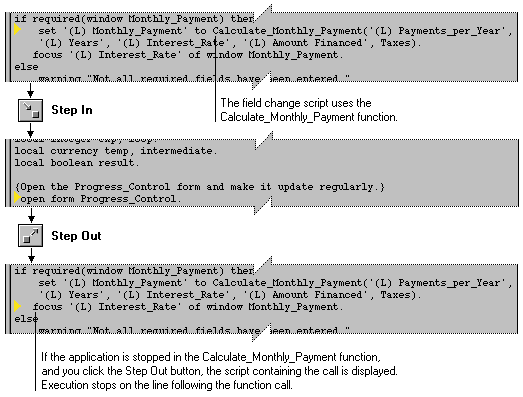
Step Out causes the current script to finish executing, then the script that called the current script is displayed in the Script Debugger window. Execution stops in the calling script on the line immediately following the line that caused the called script to be run.
For example, a field change script uses the Calculate_Monthly_Payment user-defined function. If execution has stopped in the script for the Calculate_Monthly_Payment function, clicking the Step Out button will cause the calling script (in this case, the field change script) to appear in the Script Debugger window. Execution will stop on the line immediately following the line containing the call to the Calculate_Monthly_Payment function.
![]()

Set Next Statement makes the line where the cursor is located the next line to be executed. Execution will continue when you click Go, Step, Step In or Step Out. Use this to skip over statements or repeat statements in the script.

|
Exercise caution when using this feature. It will alter the order that statements are executed in the application and may cause different results from when the application runs normally. |