The Debug menu contains the items used to control the Script Profiler: Profile Scripts, Clear Profile and Save Profile.
Choose this menu item to start the process of profiling scripts. When you choose it, Dexterity will begin keeping a record in memory of all the scripts called by your application and the tables that were accessed. When you save the profile, it will be copied from memory to a disk file.
You can turn the script profiler off at any time by choosing the Profile Scripts menu item. If you turn the profiler on again later, the new profile information will be added to the previous information. This allows you to selectively control which portions of the application are profiled. For instance, if you want to profile only the scripts from an invoicing window and an inventory window, you can turn the script profiler on while the invoicing window is active, turn it off while using other windows, and turn it on again when the inventory window is active.

|
Be sure to turn off the script profiler before leaving test mode. Otherwise, it will profile scripts called by Dexterity, making it difficult to tell your application’s scripts from Dexterity’s. |
Choose this menu item to clear current profile information from memory and start a new profile.
Choose this menu item to save the current profile to a disk file. Choosing this menu item doesn’t clear the current profile from memory or turn off the script profiler; it simply saves the current profile to the location you specify so you can examine its contents. When you choose this item, a dialog box will appear; specify a name, location and file format for the profile. You can select text format or tab-delimited format.
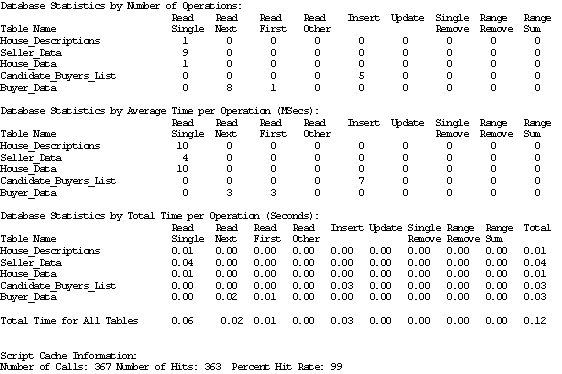
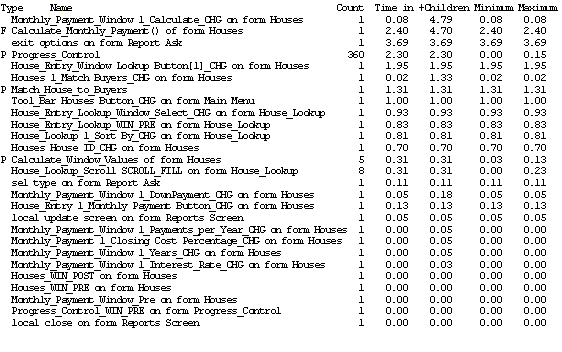
The following is an example script profile that has been saved as a text file.
![]()